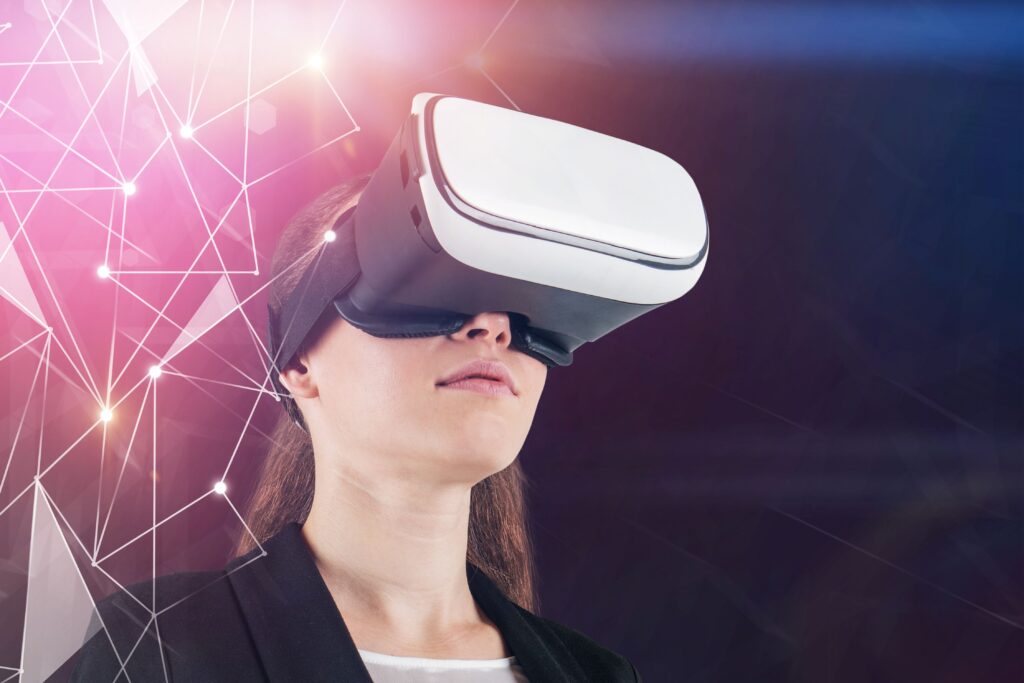
Data Visualization in Virtual Reality
Table of Contents:
Key Points
-
Breaking the 3D Barrier: Unlike traditional 2D charts, VR adds a third dimension to data analytics. This spatial depth allows users to move through vast datasets seamlessly, making it possible to visualize complex relationships and high-dimensional statistics that are often lost on a flat screen.
-
Psychology of Immersion: VR provides a completely distraction-free environment. By isolating the user from office noise, smartphone notifications, and visual distractors, the technology ensures maximum focus, leading to fewer errors and a higher capacity to spot subtle patterns and trends.
-
Spatial Interface and Interaction: In VR, your entire surroundings become the interface. Users can use natural gestures to zoom, rotate, and manipulate data objects in real-time. This hands-on approach makes data interaction intuitive, allowing for easier comparison of stats by physically moving them within the virtual space.
-
Optimized Cognitive Processing: Humans process visual information significantly faster than text. VR leverages this by using the layout and 3D visual elements to fill a larger portion of our brain’s processing capacity. The result is a dramatic increase in data processing speed and more informed, efficient decision-making.
Data visualization in virtual reality is an excellent choice. It eliminates many distractions, gives you more space to use, enables you to process data faster, and lets you interact with the data. In this article, we should examine this solution further – we invite you to read on.
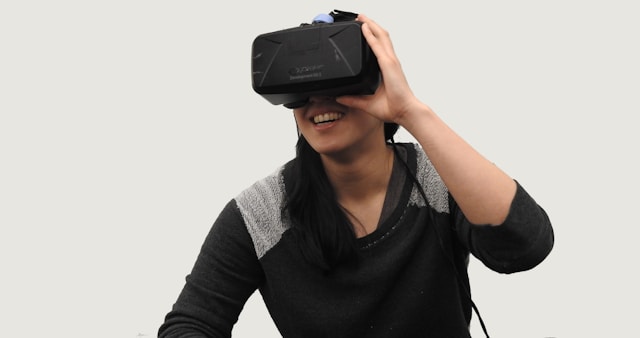
What Is VR Data Visualization?
VR data visualization is… just your traditional data visualization conducted in virtual reality. Similar as it may seem, it’s actually quite different from the traditional methods. Due to the 3D environment and the possibility to interact with every element and mold the world to your needs, VR creates an environment for truly immersive analytics.
What are the main features of data visualization in VR?
- 3D display – Unlike your traditional data visualization settings, VR adds a third dimension to the mix, letting you see more information at once and move through it seamlessly.
- Immersion – Data visualization is immersive if you use VR – you can use different images to truly feel the data you are analyzing, hence immersing yourself in the experience and making it less monotonous. This is important as it boosts creativity, enabling you to draw better conclusions and spot patterns that you would miss otherwise.
- Interaction – VR data visualization is interactive – you can move each of the objects you see, manipulate the display and maintain the level of detail by simple gestures.
The Benefits of Using VR for Data Visualization
The advantages of VR-driven data visualization are among the reasons why businesses need to invest in VR. What are these benefits in particular? Let’s take a look at them.
Distraction-Free Environment
When sitting in an office analyzing data, there are a lot of distractions that could slow down the process or cause you to miss out on important chunks of information. Your phone, the sounds from the outside world, and even the lights or simple everyday objects might make your attention wander in the wrong direction. With immersive data visualization in virtual reality, this is no longer a problem.
When submerged in the virtual world, you won’t see the visual distractors that could keep you off track in a traditional setting. As a result, you become more efficient and effective while making fewer errors.
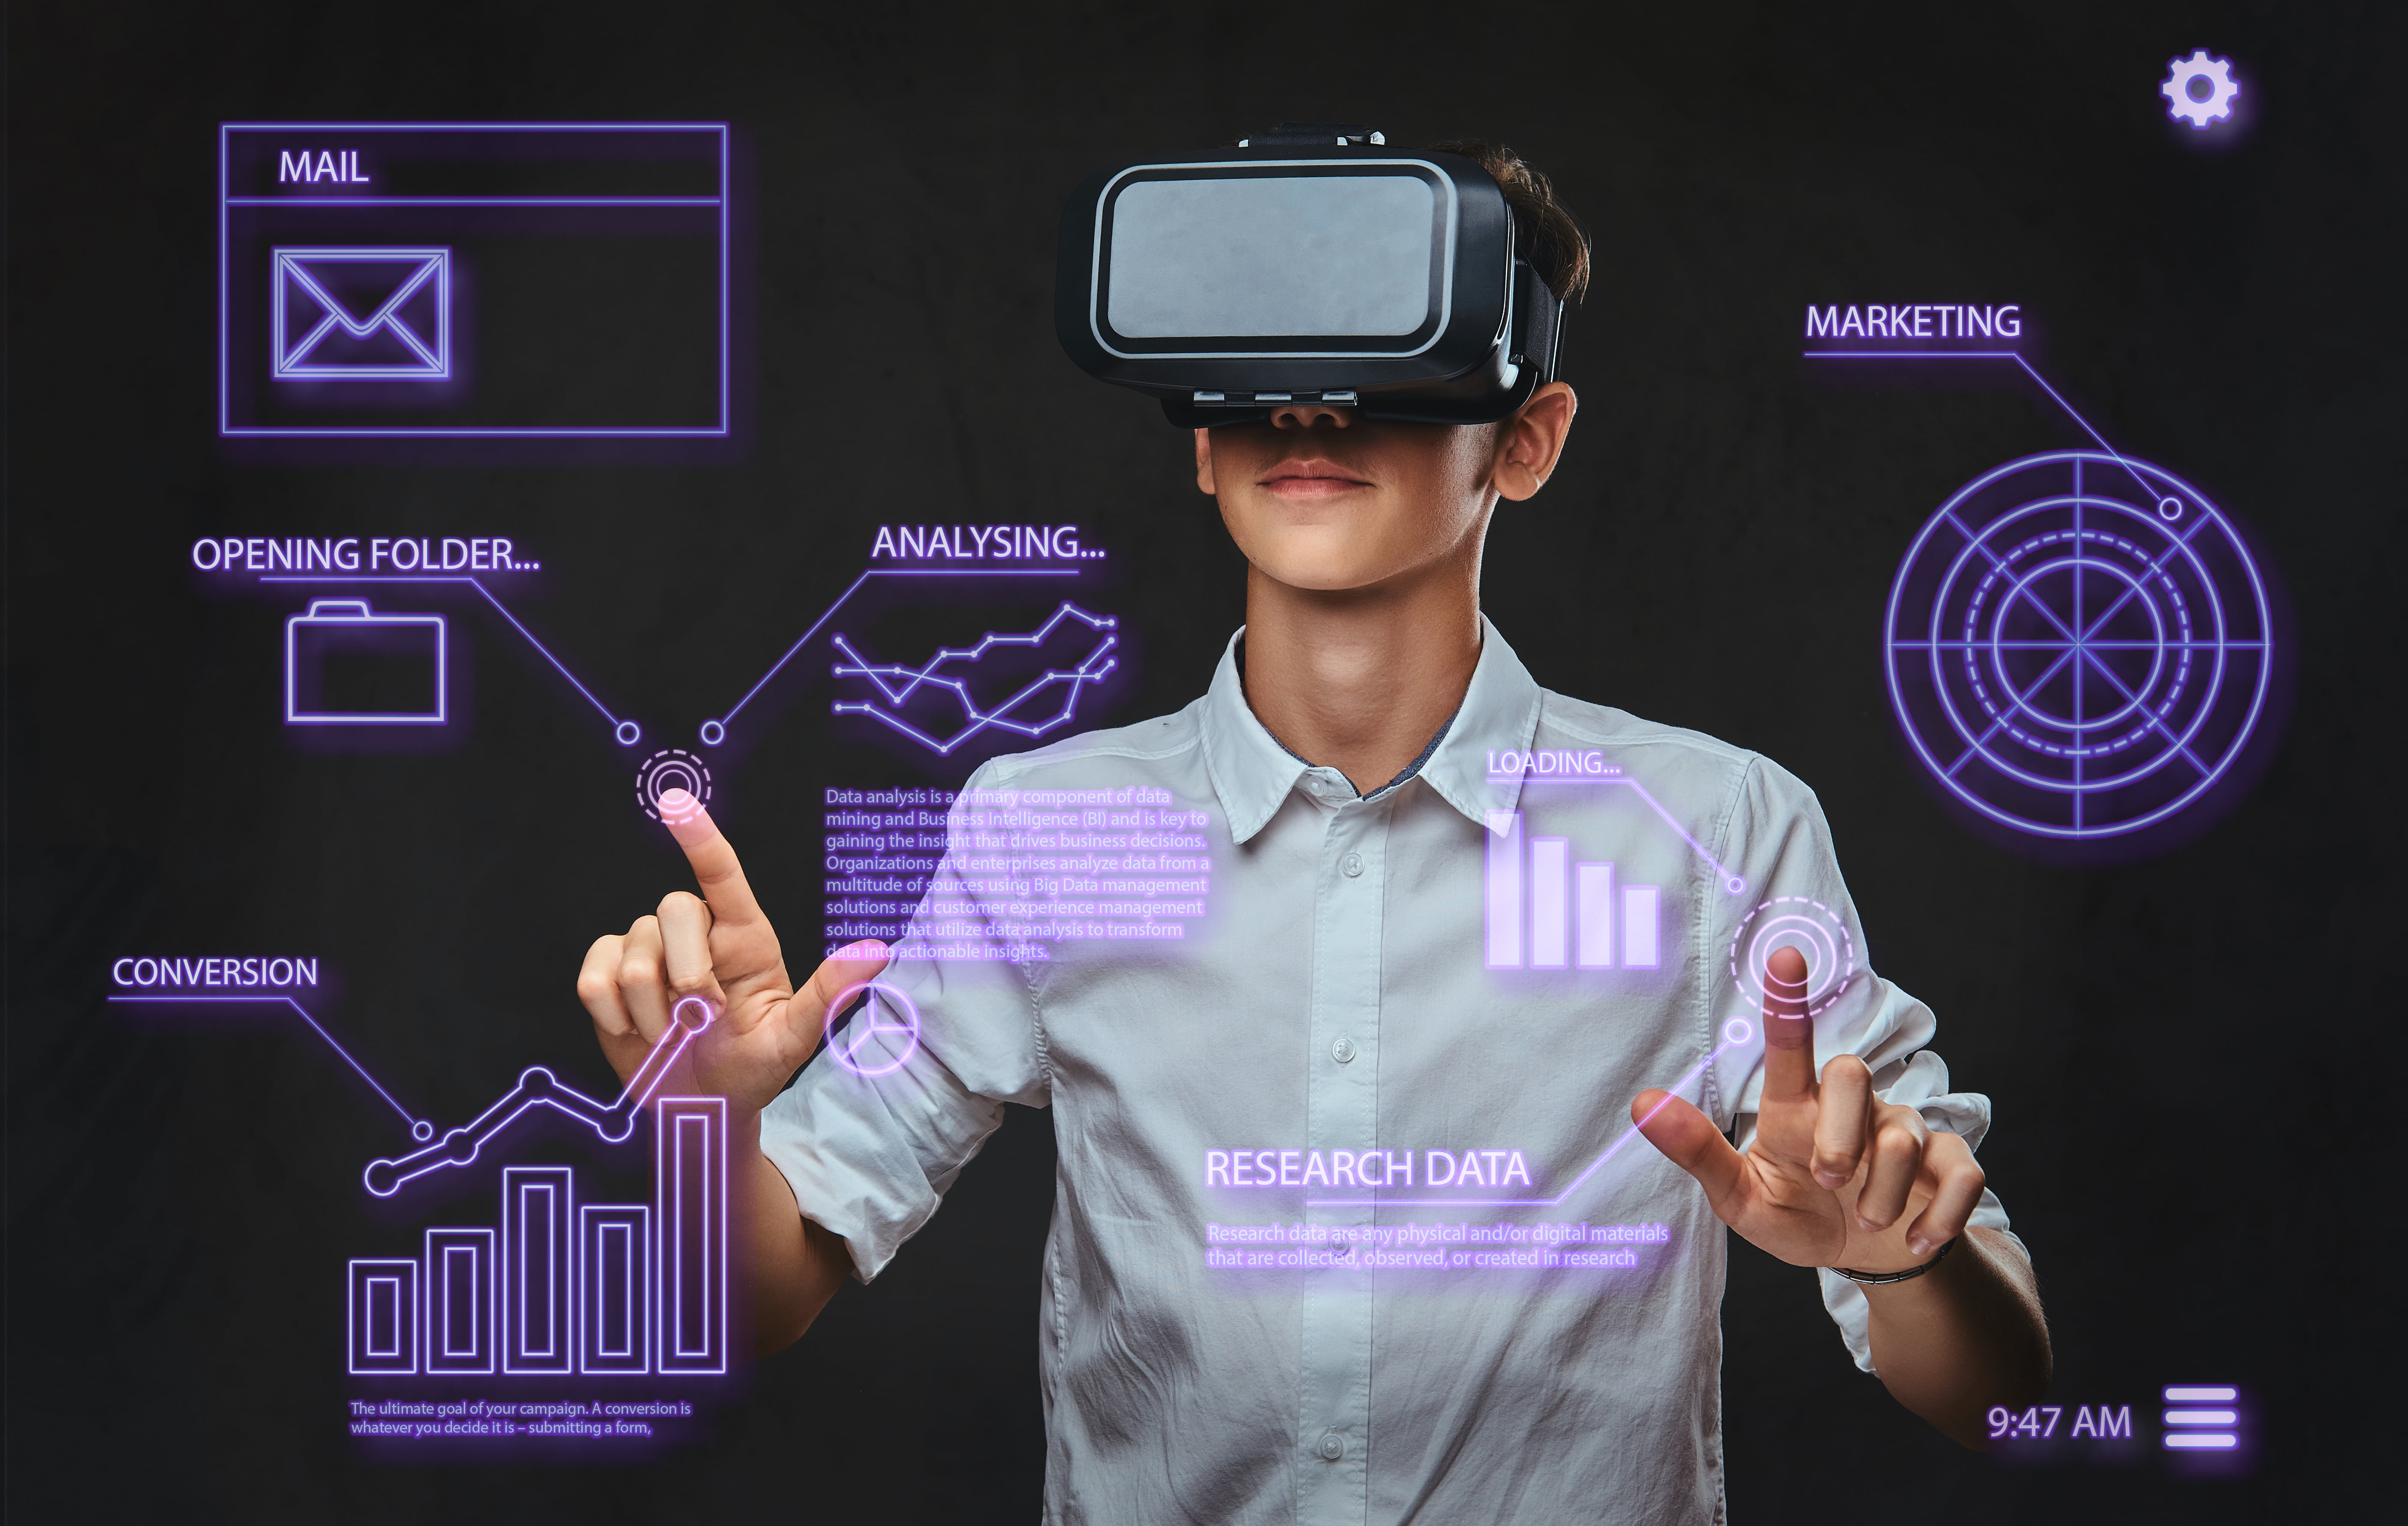
Data Accessibility and Interaction
With traditional data visualization, you are restricted by the interface. But what if your surroundings become the interface? This is exactly what happens when you use VR for data visualization.
By using the whole space around you, you can view, zoom in and out, analyze, and move more data. This shall help you keep the data organized and easily move it from one place to another, for example to compare certain stats when looking for trends and patterns.
Faster Data Processing
How does VR impact data processing speed? It all goes down to the layout.
When reading, we use just a small percentage of our information processing capabilities. To use them to the fullest extent, we need to combine them with visual elements. All marketers understand that – it’s the cornerstone of video marketing and reels. But what does it have to do with data analytics?
Due to the use of VR and more space to showcase your data, it becomes possible to add more visual elements and use the layout to display the information. This allows you to read the data more quickly and process information faster than through traditional means.
The Takeaway
VR is a powerful tool for creating immersive data visualization settings. Implementing virtual reality for this process comes with numerous benefits, which, in the end, lead to better and faster decision-making. Therefore, do not hesitate to invest in VR data visualization, as it is the future of business, no matter the industry.
You might also like: VR and AR in financial data visualization
What is the main difference between traditional and VR data visualization?
The main difference lies in the environment and dimensions. Traditional visualization is limited to 2D screens and static interfaces. VR data visualization adds a third dimension (3D), providing an immersive space where the entire environment becomes the interface, allowing for deeper interaction and better pattern recognition.
How does VR improve focus during data analysis?
VR provides a distraction-free environment by completely submerging the user in a virtual world. This isolates the analyst from real-world visual and auditory distractors like office noise or phone notifications, leading to higher efficiency, fewer errors, and more effective data processing.
Why is data processing faster in virtual reality?
Data processing is faster because humans process visual information more efficiently than text. VR uses the vast virtual layout to display information through 3D visual elements, utilizing a larger percentage of our brain’s processing capabilities compared to reading traditional 2D reports.
Can I interact with the data in VR?
Yes, interaction is a core feature of VR analytics. You can use simple gestures to move objects, zoom in on specific datasets, manipulate displays, and physically rearrange information to compare different statistics and find hidden trends.

Author: Rafał Siejca
Rafal has over twenty years of corporate experience, including roles at Millennium Bank, Comarch, and leading software teams at PZU, one of Europe’s largest insurance companies. As one of Poland’s few true VR experts with a decade of experience, he ensures timely, high-quality project delivery as CEO and CTO.